> ## Documentation Index
> Fetch the complete documentation index at: https://helpcenter.recotap.com/llms.txt
> Use this file to discover all available pages before exploring further.
# Campaign Reports: View & Optimize
> Read campaign performance and iterate targeting, creatives, and budget.
export const SupademoEmbed = ({src, title = "Watch interactive guide"}) => {
const [show, setShow] = useState(false);
if (!show) {
return
;
}
return ;
};
## Optimize via Campaign Reports
The individual reporting section after a campaign launch can be accessed by **clicking over the particular campaign**.
The **Reports** section provides a centralized view to understand how your campaigns are performing across multiple dimensions.
> Watch a quick guide on how to optimize the campaign via Reports.
Here's a breakdown of the tabs available:
## **Campaigns Performance**
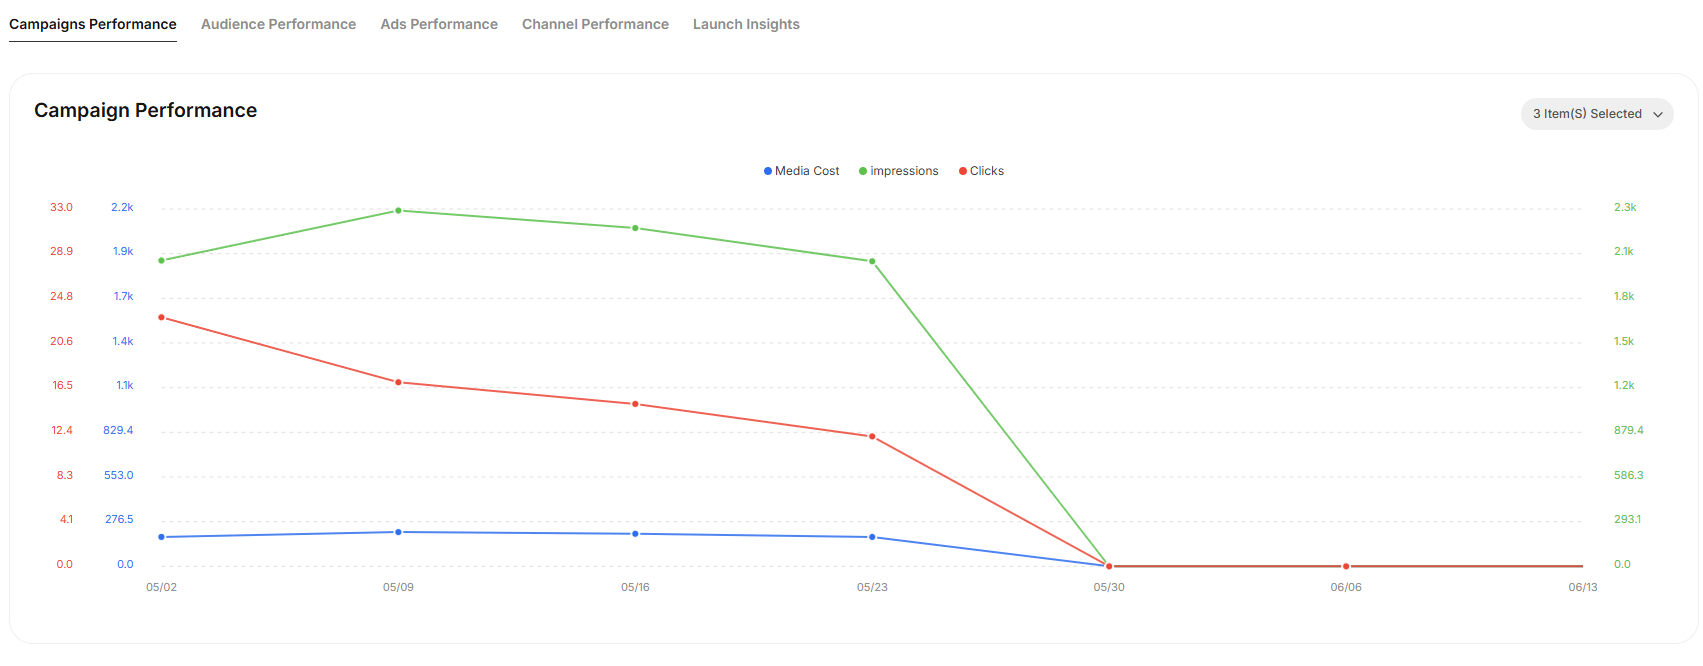
* **Metrics Tracked:** By default, Media cost, Impressions, Clicks are selected to give a graphical view that shows trends over time, enabling you to analyze the cost-effectiveness and engagement of your campaigns.
**Below metrics can be selected too to give a graphical view.**
* Conversions
* Avg. CPM
* Avg. CPC
* Avg. CTR
* Avg. CPV
## **Audience Performance**
Get a **granular view of how your audience is interacting** with your campaigns.
**You will find below segmentation under Audience Performance:**
**Key filters:**
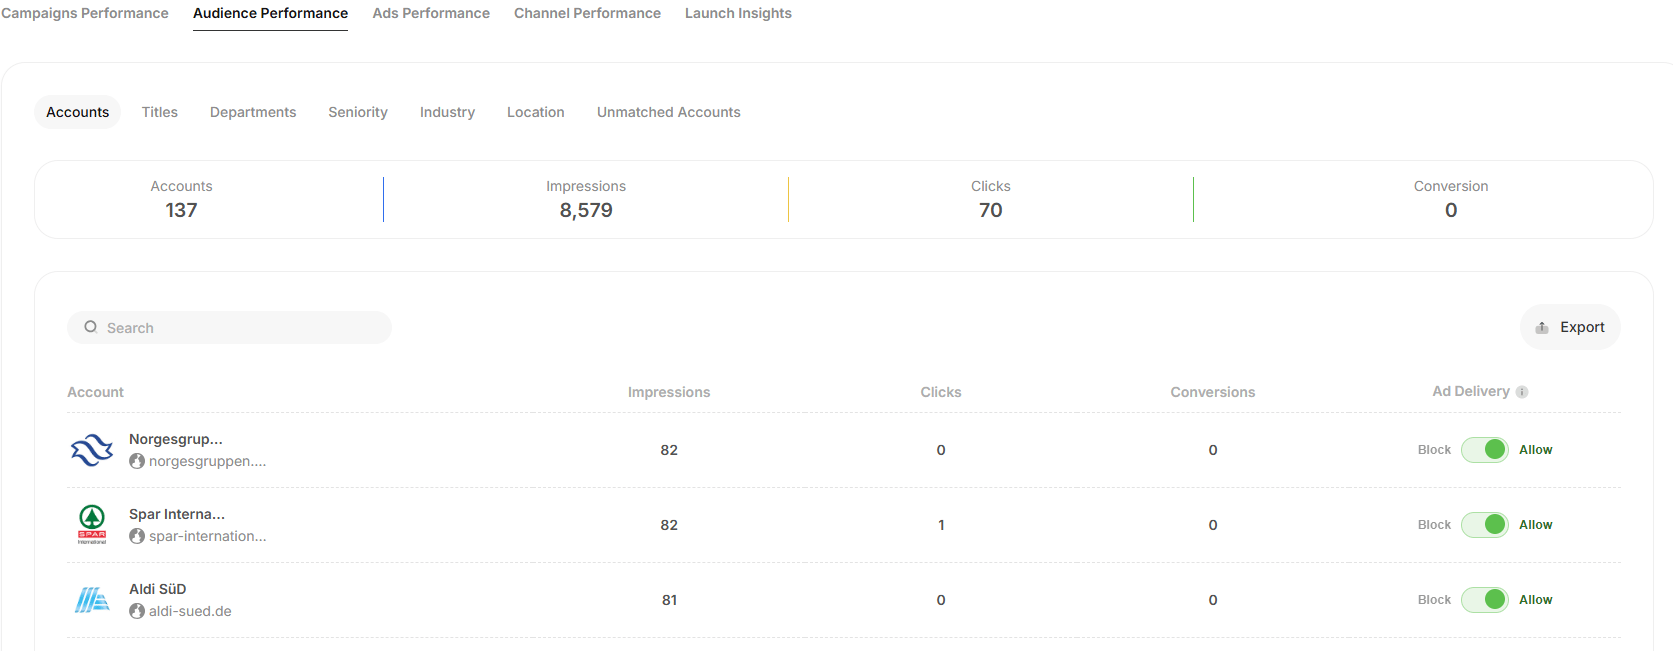
* **Accounts**: See impressions, clicks, and delivery status at the account level. You can choose to *allow* or *block* delivery for any account.
* **Titles**: View engagement segmented by job titles.
* **Departments**: See which departments are getting reached.
* **Seniority**: Analyze delivery and interaction based on seniority levels.
* **Industry**: Track performance by industry verticals.
* **Location**: Monitor reach and engagement by geography.
* **Unmatched Accounts**: Identify accounts that didn’t have a valid LinkedIn page or there is no match.
This section is useful for understanding where your ads are landing and with whom.
## **Ads Performance**
* **Metrics Tracked:**
* **Media cost spent per ad**
* **Number of impressions and views**
* **Click metrics**
* **Video-specific metrics** such as view rates and drop-off points (e.g. views at 25%, 50%, 100%)
* **Use Case:** Performance details by each ad creative, providing insights into which creatives resonate best with the audience.
[20250619-1725-44.4646048.mp4](13%202%20Campaign%20Reports%20View%20&%20Optimize/20250619-1725-44.4646048.mp4)
## **Channel Performance**
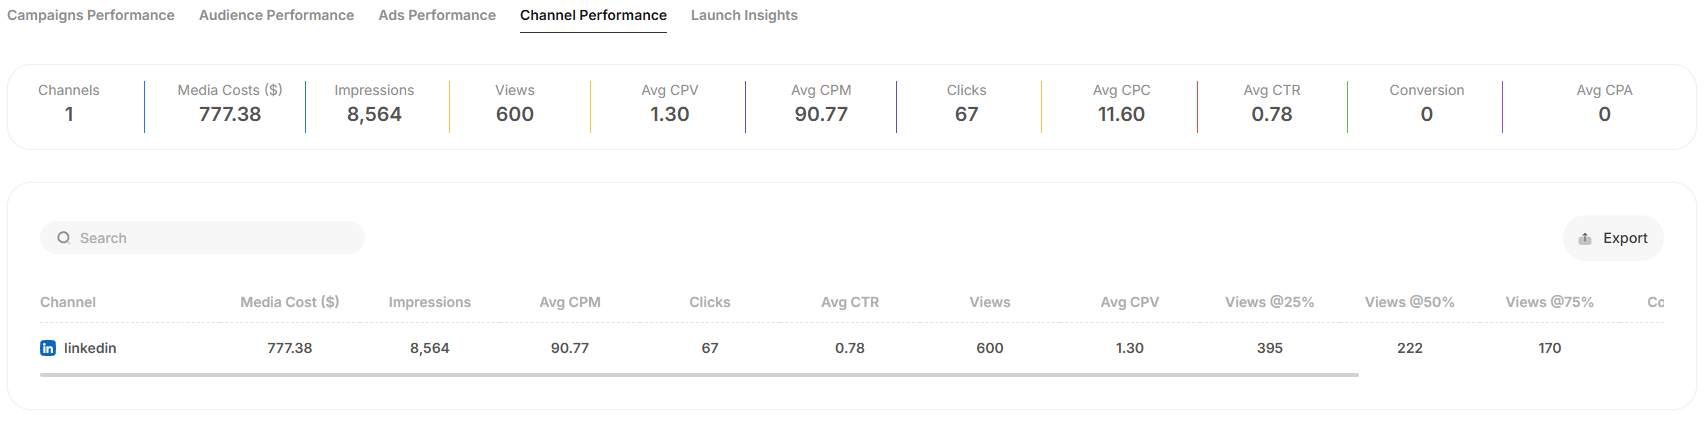
* **Metrics Tracked:**
* Media Cost spent per channel
* Impressions/Views
* Click Metrics
* **Video-specific metrics** such as view rates and drop-off points (e.g. views at 25%, 50%, 100%)
* **Use Case:** Compares performance across channels to identify which platform delivers the best ROI.
## **Launch Insights**
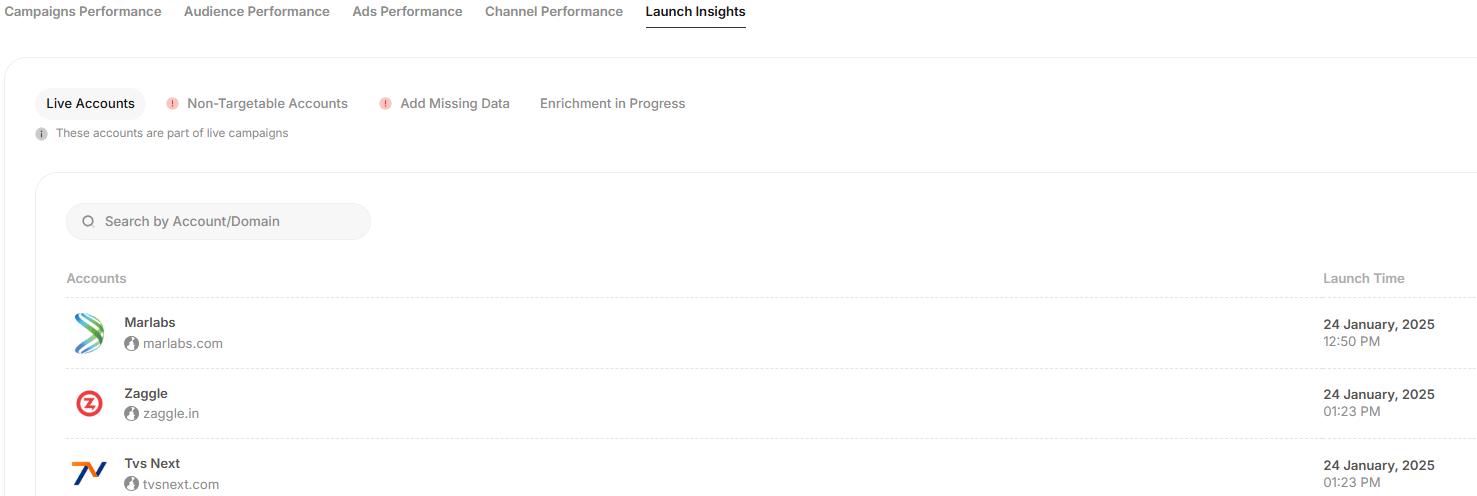
The **Launch Insights** page provides a detailed report on the **status of accounts** that are part of the campaign. This section helps troubleshoot delivery and setup issues.
### **Tabs for Account Status**
1. **Live Accounts**: Accounts that have successfully gone live with **Launch Time** i.e. when the campaign was activated for that account
2. **Non-Targetable Accounts**: These accounts within the campaign couldn't be targeted, likely due to lesser reach.
3. **Add Missing Data**: Shows accounts that are not targetable due to missing values required for personalization. For instance, if a dynamic variable like *Industry* is used and certain accounts lack this information, those accounts will be listed here.
4. **Enrichment in Progress:** Accounts currently being enriched with missing data in terms of HQ and LinkedIn page.
### **Search Bar**
* Enables users to quickly **find accounts** by entering their domain or account name.
## **Export Options**
For all tabs, you can **export data** for offline analysis or reporting. This functionality ensures seamless data sharing and storage for team discussions and decision-making.
By monitoring these metrics, you can assess the success of your campaigns and adjust strategies for better performance in the future.
 **Below metrics can be selected too to give a graphical view.**
* Conversions
* Avg. CPM
* Avg. CPC
* Avg. CTR
* Avg. CPV
## **Audience Performance**
Get a **granular view of how your audience is interacting** with your campaigns.
**You will find below segmentation under Audience Performance:**
**Key filters:**
* **Accounts**: See impressions, clicks, and delivery status at the account level. You can choose to *allow* or *block* delivery for any account.
* **Titles**: View engagement segmented by job titles.
* **Departments**: See which departments are getting reached.
* **Seniority**: Analyze delivery and interaction based on seniority levels.
* **Industry**: Track performance by industry verticals.
* **Location**: Monitor reach and engagement by geography.
* **Unmatched Accounts**: Identify accounts that didn’t have a valid LinkedIn page or there is no match.
This section is useful for understanding where your ads are landing and with whom.
**Below metrics can be selected too to give a graphical view.**
* Conversions
* Avg. CPM
* Avg. CPC
* Avg. CTR
* Avg. CPV
## **Audience Performance**
Get a **granular view of how your audience is interacting** with your campaigns.
**You will find below segmentation under Audience Performance:**
**Key filters:**
* **Accounts**: See impressions, clicks, and delivery status at the account level. You can choose to *allow* or *block* delivery for any account.
* **Titles**: View engagement segmented by job titles.
* **Departments**: See which departments are getting reached.
* **Seniority**: Analyze delivery and interaction based on seniority levels.
* **Industry**: Track performance by industry verticals.
* **Location**: Monitor reach and engagement by geography.
* **Unmatched Accounts**: Identify accounts that didn’t have a valid LinkedIn page or there is no match.
This section is useful for understanding where your ads are landing and with whom.
 ## **Ads Performance**
* **Metrics Tracked:**
* **Media cost spent per ad**
* **Number of impressions and views**
* **Click metrics**
* **Video-specific metrics** such as view rates and drop-off points (e.g. views at 25%, 50%, 100%)
* **Use Case:** Performance details by each ad creative, providing insights into which creatives resonate best with the audience.
[20250619-1725-44.4646048.mp4](13%202%20Campaign%20Reports%20View%20&%20Optimize/20250619-1725-44.4646048.mp4)
## **Channel Performance**
* **Metrics Tracked:**
* Media Cost spent per channel
* Impressions/Views
* Click Metrics
* **Video-specific metrics** such as view rates and drop-off points (e.g. views at 25%, 50%, 100%)
* **Use Case:** Compares performance across channels to identify which platform delivers the best ROI.
## **Ads Performance**
* **Metrics Tracked:**
* **Media cost spent per ad**
* **Number of impressions and views**
* **Click metrics**
* **Video-specific metrics** such as view rates and drop-off points (e.g. views at 25%, 50%, 100%)
* **Use Case:** Performance details by each ad creative, providing insights into which creatives resonate best with the audience.
[20250619-1725-44.4646048.mp4](13%202%20Campaign%20Reports%20View%20&%20Optimize/20250619-1725-44.4646048.mp4)
## **Channel Performance**
* **Metrics Tracked:**
* Media Cost spent per channel
* Impressions/Views
* Click Metrics
* **Video-specific metrics** such as view rates and drop-off points (e.g. views at 25%, 50%, 100%)
* **Use Case:** Compares performance across channels to identify which platform delivers the best ROI.
 ## **Launch Insights**
The **Launch Insights** page provides a detailed report on the **status of accounts** that are part of the campaign. This section helps troubleshoot delivery and setup issues.
### **Tabs for Account Status**
1. **Live Accounts**: Accounts that have successfully gone live with **Launch Time** i.e. when the campaign was activated for that account
2. **Non-Targetable Accounts**: These accounts within the campaign couldn't be targeted, likely due to lesser reach.
3. **Add Missing Data**: Shows accounts that are not targetable due to missing values required for personalization. For instance, if a dynamic variable like *Industry* is used and certain accounts lack this information, those accounts will be listed here.
4. **Enrichment in Progress:** Accounts currently being enriched with missing data in terms of HQ and LinkedIn page.
### **Search Bar**
* Enables users to quickly **find accounts** by entering their domain or account name.
## **Launch Insights**
The **Launch Insights** page provides a detailed report on the **status of accounts** that are part of the campaign. This section helps troubleshoot delivery and setup issues.
### **Tabs for Account Status**
1. **Live Accounts**: Accounts that have successfully gone live with **Launch Time** i.e. when the campaign was activated for that account
2. **Non-Targetable Accounts**: These accounts within the campaign couldn't be targeted, likely due to lesser reach.
3. **Add Missing Data**: Shows accounts that are not targetable due to missing values required for personalization. For instance, if a dynamic variable like *Industry* is used and certain accounts lack this information, those accounts will be listed here.
4. **Enrichment in Progress:** Accounts currently being enriched with missing data in terms of HQ and LinkedIn page.
### **Search Bar**
* Enables users to quickly **find accounts** by entering their domain or account name.
 ## **Export Options**
For all tabs, you can **export data** for offline analysis or reporting. This functionality ensures seamless data sharing and storage for team discussions and decision-making.
By monitoring these metrics, you can assess the success of your campaigns and adjust strategies for better performance in the future.
## **Export Options**
For all tabs, you can **export data** for offline analysis or reporting. This functionality ensures seamless data sharing and storage for team discussions and decision-making.
By monitoring these metrics, you can assess the success of your campaigns and adjust strategies for better performance in the future.